Main menu
You are here
nanoVNA
[last updated: 2023-11-13]
ham radio home page
antenna theory
testing a DIY 70cm antenna
Detailed Explanation of Impedance
nanoVNA-Saver
-----
======================================
to research and add...
(NanoVNA-App, NanoVNA-Sharp, NanoVNA-Server).
======================================
On This Page:
- My model
- Operation Notes
- Calibration:
- Measurements:
- Software
- Reference Links
-----------------------------------
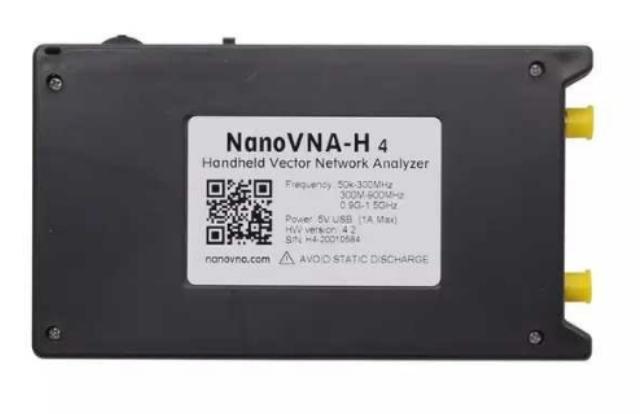
- Details on the model I purchased:
- Operation Notes:
- Power on/off with the slide switch on the top edge of the case.
- To open the menu:
- Press the roller switch down. Then rolling the switch back and forth will move the selection up or down in the menu bar.
- -OR- Touch anywhere on the screen with your finger. Touching again will hide it again.
- -OR- BEST way: Use a stylus to touch the screen.
IMO the roller switch and touch screen are semi-flakey, and operation works much better to just use a stylus.
Except for: The roller switch is the best method for dragging the trace markers, see below.
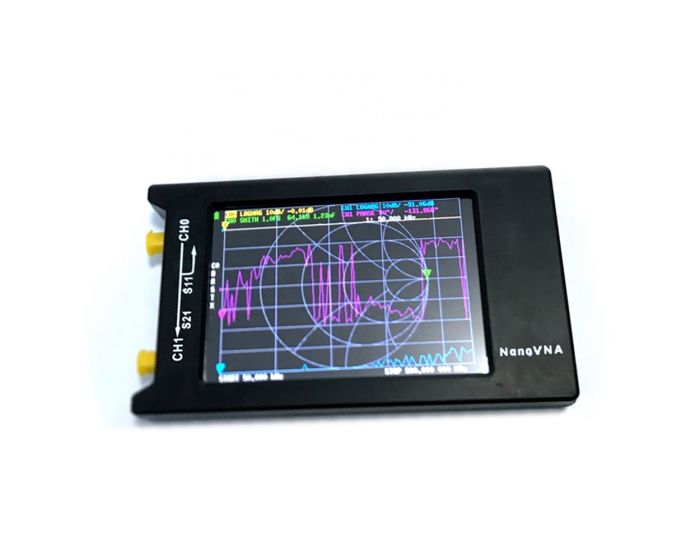
- Channels/Ports:
- Most VNA's have two Ports, which they label Port-1 and Port-2
- The nanoVNA, however labels it's ports: CH0 and CH1
- To be consistent with other VNA's, remember:
- CH0 = Port-1
CH1 = Port-2
- Traces:
- On power up, all 4 traces will be shown on the screen:
Trace 1: yellow - CH0
Trace 2: green - CH0
Trace 3: blue - CH1
Trace 4: magenta - CH1Also, at the top of the screen, you'll see two lines listing the 4 traces, along with their channel designation and their measurement format.
menu > DISPLAY > TRACE will show the trace menu.
On power up, all 4 trace listings in the menu will be highlighted with their trace color. - To remove/hide a trace:
menu > DISPLAY > TRACE
Press the menu listing (usu. twice) so that the highlighting goes away. The trace will be removed from the screen. - To show a trace that is not showing on the screen:
menu > DISPLAY > TRACE
Click the trace listing that you want to show. The menu listing will highlight with its color and the trace should show on the display screen. - To Select a trace:
At any given time, only one trace will be "selected".
You can see which trace is currently selected at the top of your display screen, where there will be a list of the traces that are displayed.- Each trace listing will show its channel (CH0 or CH1), the measurement format (LOGMAG or SWR or whatever), and the value that is measured at that moment.
One of the traces (default is Trace 0) will have its channel listing highlighted. This is the trace that is currently "selected."If you make a change to a trace, eg measurement format or scale, the "selected" trace is the one that will be changed.
To "select" a trace: menu > DISPLAY > TRACE
Click (usually just once) the trace you want to select. The "CHx" listing at the top should change to now highlight the trace you've selected.
If you show/display a trace that was previously hidden, then it will become the "selected" trace. - Trace Markers:
- By default each trace will have a marker, a point-down triangle, with a number (default "1") in it.
This is the point (frequency) on the plot where the displayed measurement is being taken. - You can move the markers along their plots (easiest way) using the roller wheel on the top edge of the case.
You can also touch your stylus to a marker and drag it. - Notice that the markers for all traces move together.
- By default each trace will have a marker, a point-down triangle, with a number (default "1") in it.
- On power up, all 4 traces will be shown on the screen:
- Change Measurement Format:
- There are several measurement/format parameters you can measure with the nanoVNA:
LOGMAG, PHASE, DELAY, SMITH, SWR, POLAR, LINEAR, REAL, IMAG, RESISTANCE, REACTANCE - Each trace can be independently set to measure whichever of these parameters you desire.
- By default on power up, TRACE 0 and 1 are set to LOGMAG, TRACE 2 reads SMITH, and TRACE 3 is set to PHASE.
- Set the traces to measure what you want as follows:
menu > DISPLAY > FORMAT
Select your desired parameter.
Remember you will be setting the measurement format for whichever trace is the currently Selected trace (see above).
- There are several measurement/format parameters you can measure with the nanoVNA:
- random blurb from some forum:
nanoVNA uses two drivers, one to communicate with PC for data transfer, like when using nanoSaver,
the other when downloading new firmware.
The blurb was talking about Windows, so not sure how relevant for Linux ... - Calibration:
------------------------------------------------------------
- Measurements:
------------------------------------------------------------
- Software:
- Firmware:
To find the firmware version in your nano:- Menu --> Config --> Version
Firmware can be updated/downloaded to your nano,
(Have not researched/documented the procedure to do so) - nanoSaver:
This is a computer program that connects to your nanoVNA and gives you expanded measurement, analyzing, saving, and viewing capabilities.
------------------------------------------------------------
- Firmware:
- Reference Links:
- groups.io nanovna-users:
(link to:) wiki
(link to:) files
(link to:) Good user manual
(go to:) excellent groups.io post - User manuals:
(link to:) Good User Manual
(link to:) Another User Manual, translated, not as good
(link to:) OK User Manual - YouTube videos:
- IMSAI Guy channel ...
- https://www.youtube.com/watch?v=tLMAStiaAxU -- recommended youtube setup video
- https://www.youtube.com/watch?v=rUDMo7hwihs -- reading impedance from a Smith Chart
- https://www.youtube.com/watch?v=1UbEz73FGCU -- 3 ways to measure Impedance (doesn't apply directly to nanoVNA; over-complicated)
- https://www.youtube.com/watch?v=_drx7ORUDWI -- measure SWR & Resonance (pretty worthless)
- https://www.youtube.com/watch?v=uA1HyScp96w -- antenna testing (pretty worthless)
- https://www.youtube.com/watch?v=8kx9SWbEcXI -- nanoVNA introduction (OK but very basic, some details about calibrating. Uses an older version of the nanoVNA)
- ttps://www.youtube.com/watch?v=ZpKoLvqOWyc -- Optimizing Antennas with a VNA (the Swiss guy)
- https://www.youtube.com/watch?v=THc5ZTxQUSg&t=21s -- OK, but very introductory/basic
- https://www.youtube.com/watch?v=R5iYuGLvlas -- Testing Coax with VNA (W6LG)
- https://www.youtube.com/watch?v=Pk7pMguQDy4 -- not bad, but long and few nuggets...
- https://www.youtube.com/watch?v=R0mRTigYzco -- ok but lots of very verbose basic stuff
- https://www.youtube.com/watch?v=5xCwI_V9VSI -- lots of talk, finally starts about 10:00...
- https://www.youtube.com/watch?v=MBGyGRb_7Tg -- ??
- https://www.youtube.com/watch?v=7TtKE39TWpI -- good but mostly irrelevant
- https://www.youtube.com/watch?v=QMgBtcUlubk -- ??
- https://www.youtube.com/watch?v=iJ1qKE5O0bY -- ??
- Other Links:
---------------------------------------------------------------------------------------------------
.
.
.
eof