Main menu
You are here
Espotek: Operation
[last updated: 2024-09-07]]
Espotek home page
-----
- Operation:
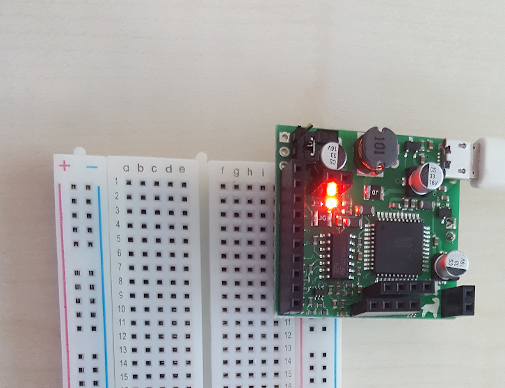
- Plug Espotek into breadboard as shown above.
Note orientation when inserted into breadboard:
Must be inserted on a breadboard edge that has the ground bus on the outside. - Do Not power the Espotek from the breadboard power bus lines.
Power to run the board is ONLY provided by the USB port.- The "power supply" pins on the back of the board,
that get inserted into the breadboard power bus when you plug the Espotek into the breadboard,
are the power OUTPUT of the Espotek programmable power supply.
They can be used to provide power (up to 0.75 W - 150ma at 5v) for peripheral components/modules.
They do not supply power into the Espotek board.
- The "power supply" pins on the back of the board,
- Connect micro USB from Espotek to your PC
- Execute appImage software (double-click).
- You may need to set properties/permissions on the appimage file in order for your PC to execute it as a program
See notes on my Espotek home page. - If Authentication window comes up, enter password for your PC.
- Prompt box will open, asking if you want calibration to run. Select your preference.
- Espotek screen will open.
- If "Device Not Connected..."
The Espotek may not be detected when connected through a hub... - Calibration routine runs (unless declined). A couple of screens, then ...
"connect both oscilloscope channels to outer shield of USB..."
Follow the prompts, do what's asked, ... - If error: "connection established ... but bandwidth limitations ... suggest moving to different port."
On my Dell-4600, this is the rear-most port on the right side. - When connected: $ lsusb will show something like ... Atmel Corp Labrador
- You may need to set properties/permissions on the appimage file in order for your PC to execute it as a program
- Adjust Espotek power supply output for desired peripheral module.
- Connect peripheral module power.
- Connect peripheral module signal to Espotek input channel.
---------------------------------------------------------------------------
- Controls:
- Channel Select:
right Side: "Device Connected"
at top: Ch1 or both Ch1 and Ch2 can be selected to be displayed
------------------------------- - Axes:
Vertical axis diplays Volts.
Horizontal axis displays Seconds.
------------------------------- - Scale Factors:
- Vertical: (voltage)
- Position mouse pointer in the trace display,
and roll the scroll wheel to change both the vertical scale factor
(aka in standard oscilloscopes as 'volts/div')
and the vertical position of the trace on the screen. - Up-down arrow keys similarly change scale factor and position
- Position mouse pointer in the trace display,
- Horizontal: (time)
- Position mouse pointer in the trace display,
press/hold CTRL, and roll scroll wheel to change scale factor (time/div) and position. - Right-left arrow keys change display position
but do not change scale factor.
- Position mouse pointer in the trace display,
-------------------------------
- Vertical: (voltage)
- Cursor:
- Horizontal: (for vertical axis, voltage measurements)
- Clicking in the display will check the horiz cursor select box,
and will display a horiz cursor line at the point clicked.
At the same time, a dashed line, positioned at the bottom of the waveform train, will be displayed.- Clicking a second time in the display will move the cursor line to the new position.
- Click-hold-drag in the display will move the main horiz cursor to the point clicked,
and will allow dragging the dashed line to a new position. - Clicking directly in the horiz cursor select box will erase the cursors.
- Vertical: (for horizontal axis, time measurements)
- Position cursor where desired for start of time duration measurement
Press-hold right click and drag to end of time duration measurement position.
Release right-click - Data box will show time positions of the two markers, delta time,
and assuming you've captured a single cycle, a frequency calculation.
- Position cursor where desired for start of time duration measurement
- A measurement header box will be displayed upon activating either cursor:
- the measured voltage value of the horiz cursor position will be represented as V0
- The measured value of the horiz dashed cursor is V1
- The difference between the measurements is [delta] V
-------------------------------
- Clicking in the display will check the horiz cursor select box,
- Trigger:
------------------------------- - ...:
-------------------------------
---------------------------------------------------------------------------
- Horizontal: (for vertical axis, voltage measurements)
- Signal Generator:
- Max freq 62.5 kHz
---------------------------------------------------------------------------
- Save a Data File:
- File -> Take Snapshot -> select CH1 or CH2
"Save-As" window opens. Browse to desired location, enter desired filename, click Save - Saved files are .csv like this:
- t, v
-0.000000, 0.014156
-0.000215, 0.014156
-0.000430, 0.037612
-0.000645, 0.037612
-0.000860, 0.037612
-0.001075, 0.037612
-0.001290, 0.061069
-0.001505, 0.037612
-0.001720, 0.061069
-0.001935, 0.061069 - time is listed in seconds [ ??? ] to six digits == microseconds[ ??? ].
- File -> Take Snapshot -> select CH1 or CH2
- Channel Select:
.
.
.
eof
- Plug Espotek into breadboard as shown above.
